Invented sample data
A sample portfolio report
Portfolio Insight on an invented portfolio of 100 initiatives. Every name and figure on this page is made up. Each measure is shown with the rule Steerline uses to calculate it.
The whole portfolio on one screen
Fourteen measures for 100 invented initiatives, filtered by business unit, with the phase mix underneath.
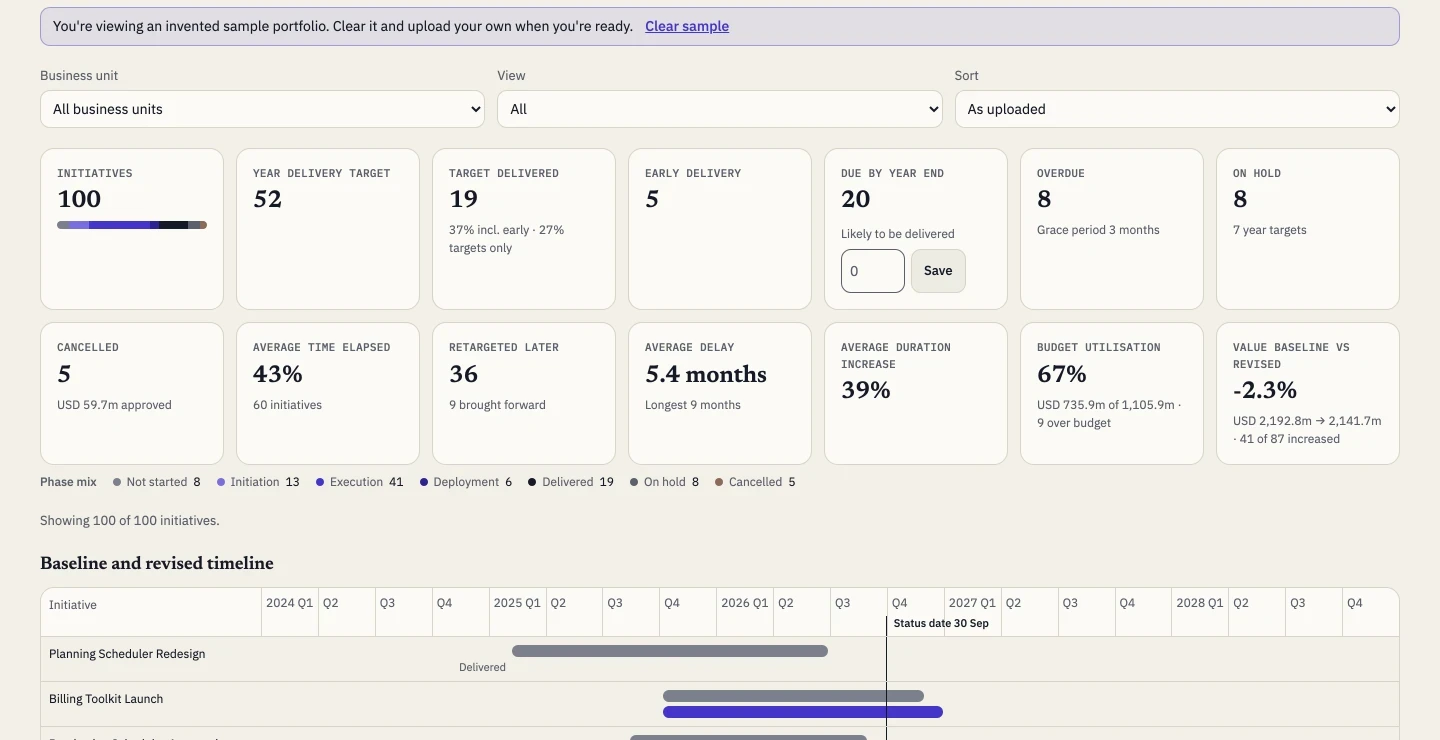
- Initiatives (100)
- Every row in the upload, as uploaded; the bar shows how many are in each current phase.
- Year delivery target (52)
- Initiatives whose planned phase at year end falls in the Delivered category.
- Due by year end (20)
- Year targets not yet delivered, on hold or cancelled, and not overdue. “Likely to be delivered” is entered by you, never calculated.
- Average time elapsed (43%)
- (status date − start) ÷ (baseline end − start), between 0% and 100%, averaged over initiatives that are not delivered, on hold, cancelled or overdue.
- Cancelled (5)
- Initiatives whose current phase is in the Cancelled category, with their approved budget total.
Delivery against the year's targets
What has been delivered against the year's targets, and what is late.
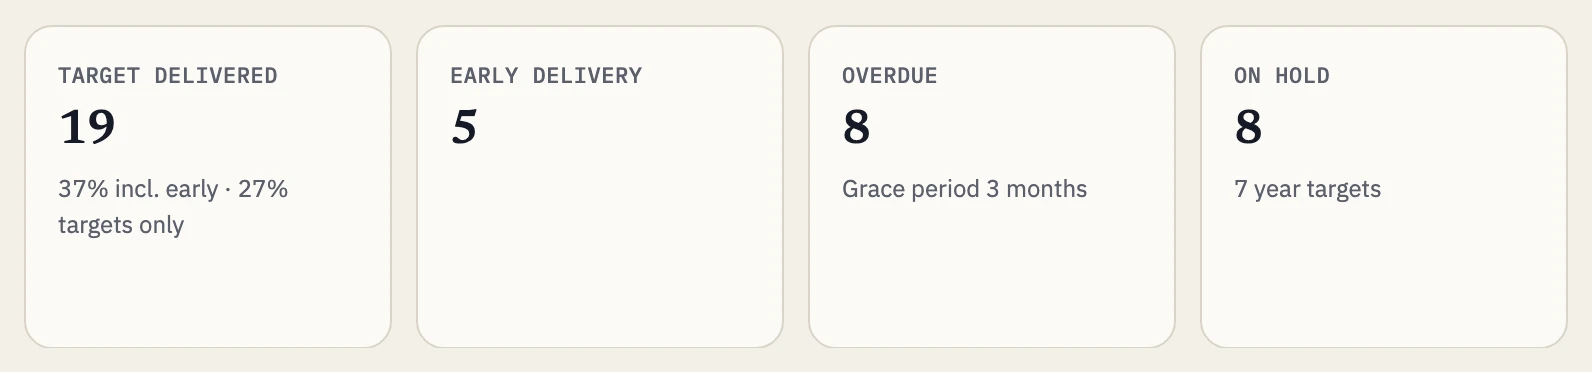
- Target delivered (19)
- All initiatives in the Delivered category, including early deliveries, shown as two percentages of the year targets: including early deliveries, and year targets only.
- Early delivery (5)
- Delivered initiatives that were not year targets.
- Overdue (8)
- Year targets not delivered, on hold or cancelled whose baseline end is on or before the status date minus the grace period (three months here). On-hold initiatives are never overdue.
- On hold (8)
- Initiatives in the On hold category, with how many of them are year targets.
Baseline and revised timeline
Each initiative's baseline bar against its revised bar, with the status date as a vertical line.
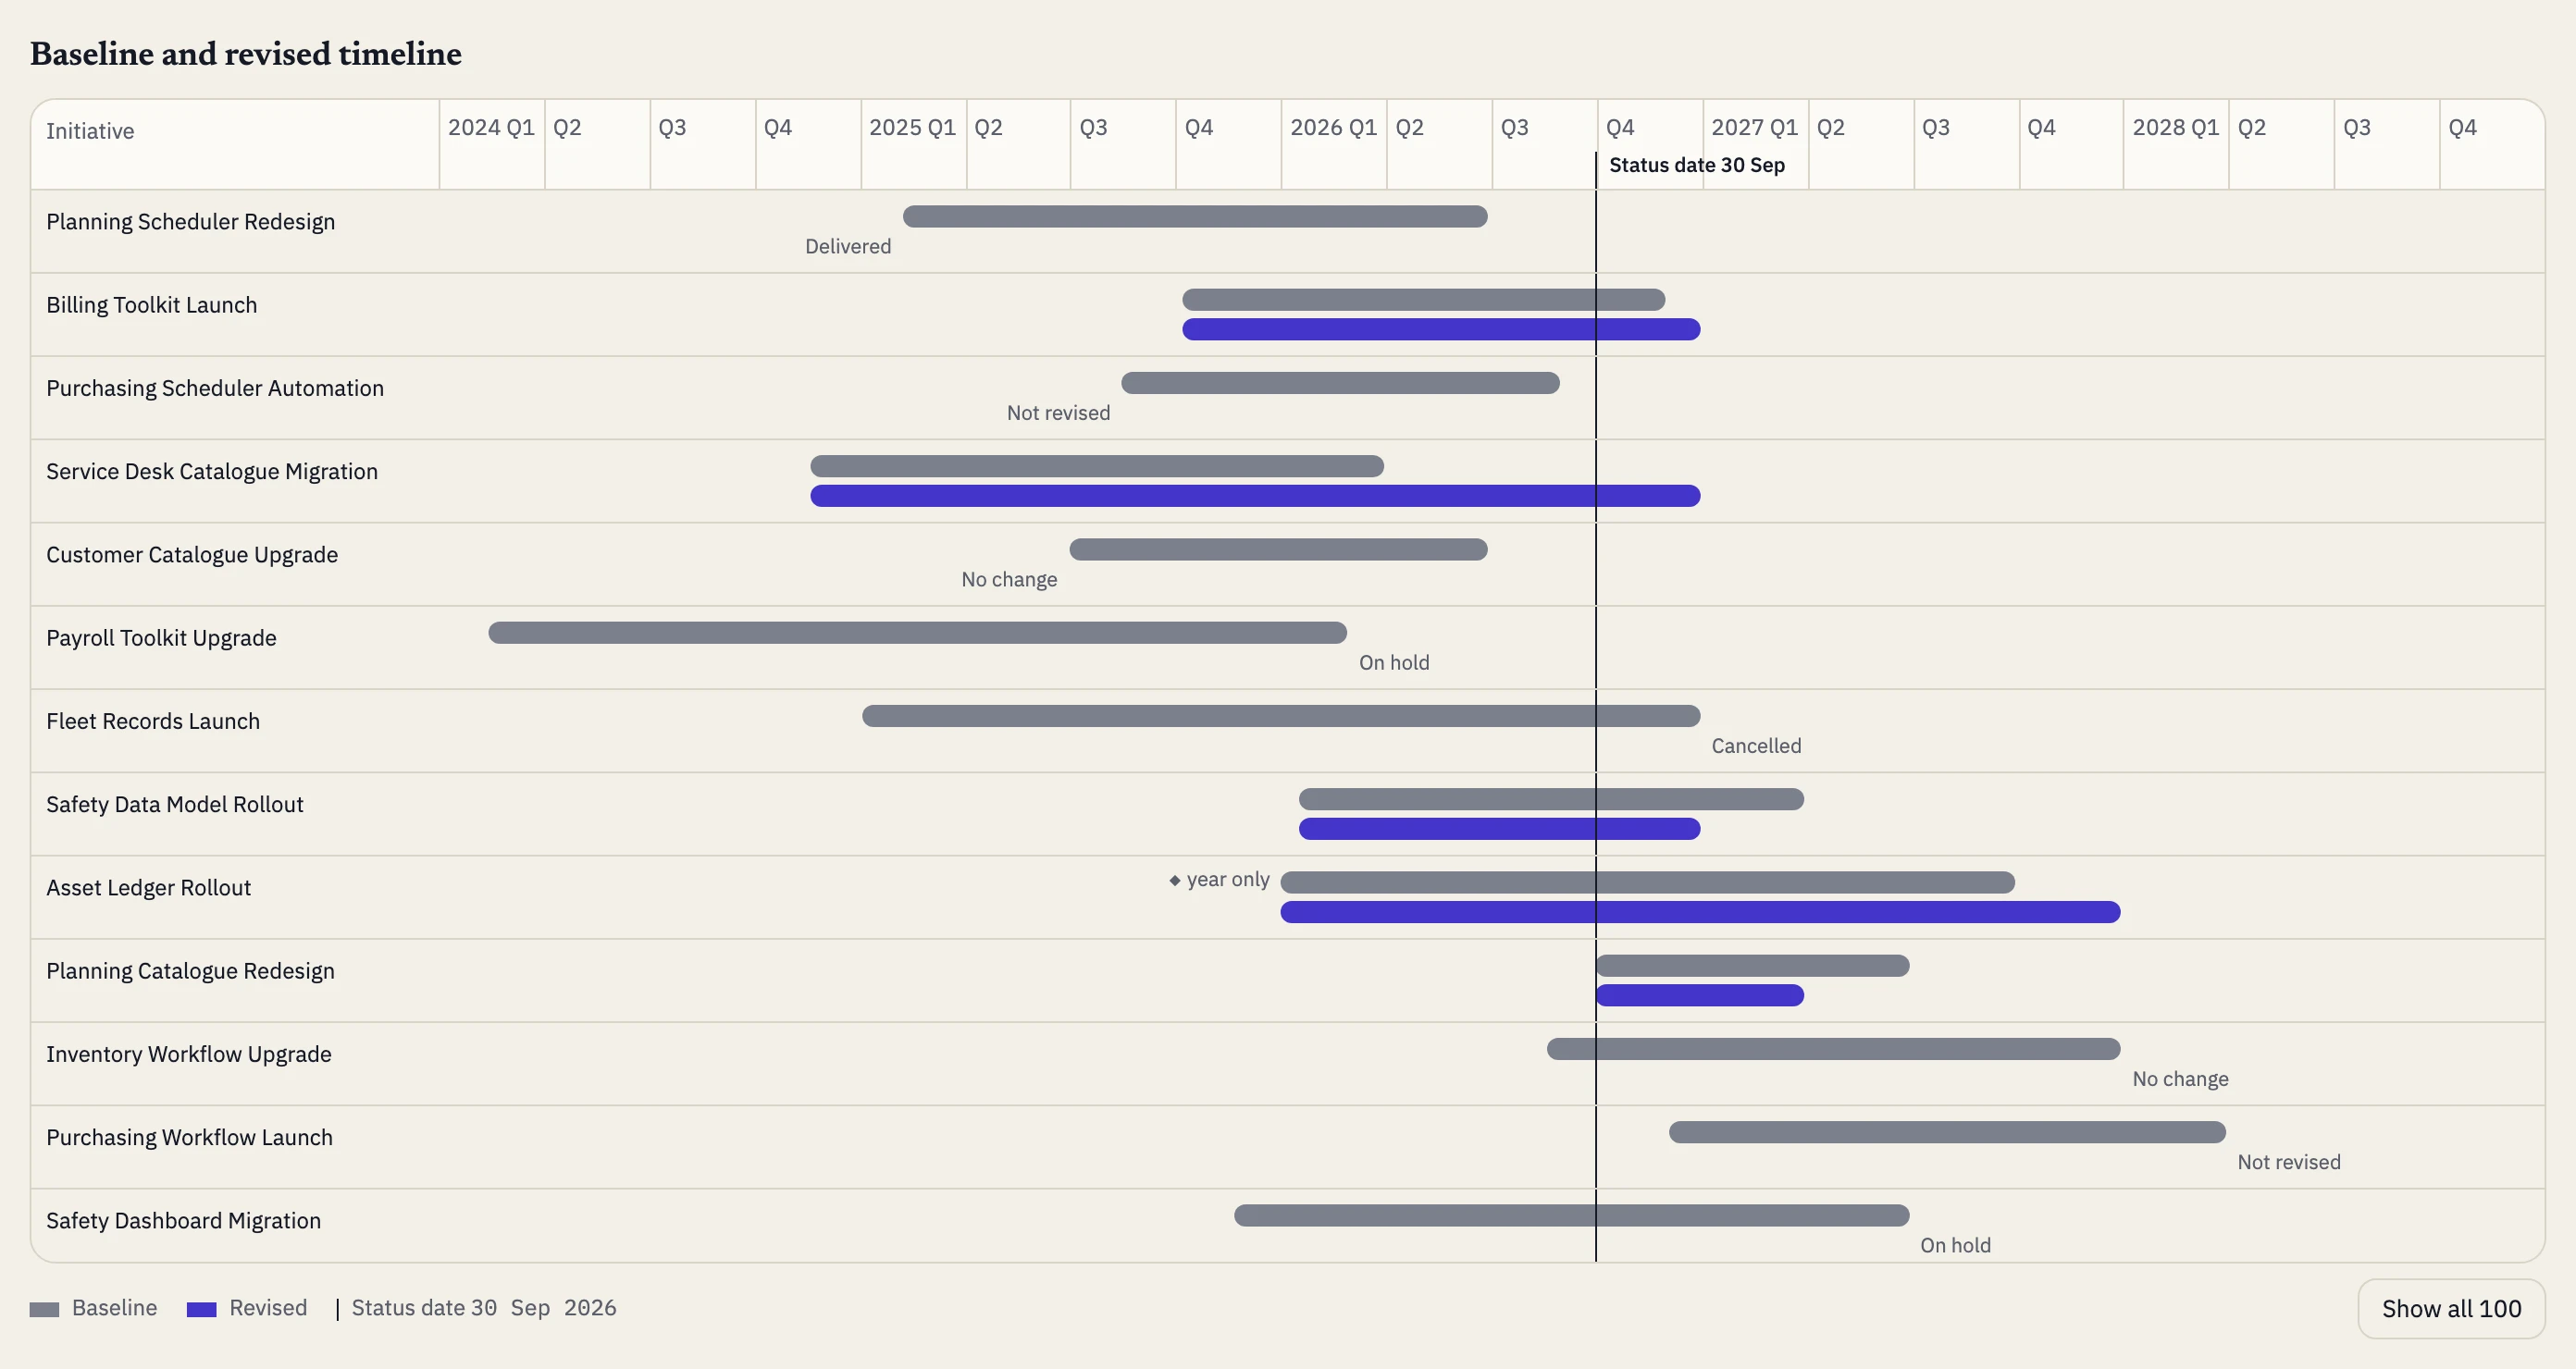
- Retargeted later (36)
- Initiatives whose revised end month is later than the baseline end month; an earlier revised end counts as brought forward, and “No change” as no delay.
- Average delay (5.4 months)
- Delay in months = (revised end year − baseline end year) × 12 + (revised end month − baseline end month); the average and the longest cover delays above zero.
Money and value
Time, budget and value, set against what was approved.
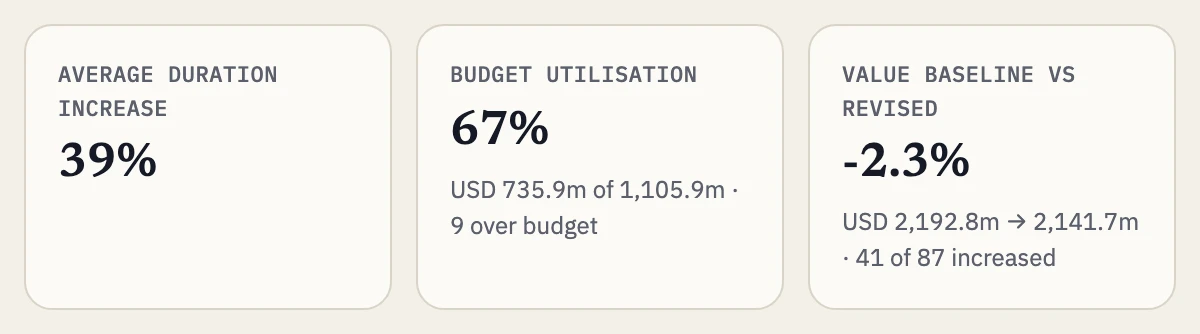
- Average duration increase (39%)
- (revised end − start) ÷ (baseline end − start) − 1, averaged over initiatives with a delay above zero.
- Budget utilisation (67%)
- Total budget used or forecast ÷ total approved budget for the reporting year; blank amounts count as zero, and over budget means used above approved.
- Value baseline vs revised (−2.3%)
- For initiatives with a baseline or revised value above zero: the change in total value as a percentage of the baseline total, and how many increased.
Before the report: the upload check
Every row is checked before anything is saved. A file with problems is never saved; each problem is listed by sheet, row and column.
